Want to know how your social media content is performing? Start by measuring reach (unique viewers) and impressions (total views, including repeats). These metrics help you understand your audience’s behavior and refine your content strategy.
Key Takeaways:
- Reach vs. Impressions: Reach tracks unique users; impressions count total views.
- Why It Matters: Higher reach shows broader visibility, while impressions reveal repeated engagement.
- Platform-Specific Tools:
- Facebook: Use Meta Business Suite for insights like organic vs. paid impressions.
- Instagram: Check "View Insights" for post-level data.
- LinkedIn: Analyze content performance via the Analytics tab.
- Twitter: Access impressions and engagement trends in Twitter Analytics.
- TikTok: Use Creator Tools for metrics like unique viewers and watch time.
- Multi-Platform Tools: Tools like Sprout Social and Hootsuite simplify tracking across platforms.
Quick Comparison:
| Metric | Definition | Example |
|---|---|---|
| Reach | Unique users who saw content | 1,000 unique users view a post once |
| Impressions | Total views (repeats included) | 1,000 users viewing a post twice = 2,000 impressions |
What Is The Difference Between Social Media Reach And Impressions? – BusinessGuide360.com

Platform-Specific Measurement Guide
To effectively measure your social media performance, it’s essential to focus on each platform individually. Here’s a breakdown of how to track metrics on major platforms.
Facebook Metrics Using Meta Business Suite

The Meta Business Suite is your go-to tool for tracking Facebook post performance. Here’s how to access and use it:
- Access Meta Business Suite: From your Facebook Page, click your profile photo, select "See all profiles," choose your Page, then navigate to the Professional Dashboard and open Meta Business Suite.
- View Post Insights: Go to the Insights tab, select Content, and then Overview to access metrics like:
- Total reach (unique viewers)
- Organic vs. paid impressions
- Post engagement data
- Story performance insights
Instagram Insights Guide
To access Instagram analytics, you’ll need a Business or Creator account. Here’s how to get started:
- For Individual Posts: Tap the post you want to analyze and select "View Insights" to review metrics such as reach and impressions.
- For Account-Wide Data: Tap the bar chart icon on your profile to access a detailed overview of your account’s performance.
LinkedIn Analytics Tools
LinkedIn provides a robust analytics section for both personal profiles and company pages. Follow these steps to access your data:
- Go to your profile or company page.
- Click on Analytics in the top menu.
- Select Content to review post-level metrics and identify top-performing posts.
Twitter Analytics Overview
Twitter Analytics offers key data to evaluate your tweet performance. Here’s what you can track:
- Impressions for individual tweets
- Total profile reach
- Engagement rates
- Audience growth trends
You can access these insights by clicking the Analytics option in your profile menu.
TikTok Dashboard Analysis
TikTok’s Creator Tools provide valuable insights into your content’s performance. Here’s what you can monitor:
- Video views (impressions)
- Unique viewers (reach)
- Average watch time
- Traffic source breakdown
If you’re using a Business account, you’ll also gain access to additional data, such as audience demographics and engagement trends.
Multi-Platform Analytics Tools
Multi-platform tools are game-changers when it comes to simplifying how you track reach and impression data. These tools pull information from different social networks into a single, easy-to-navigate dashboard.
Sprout Social Dashboard Features
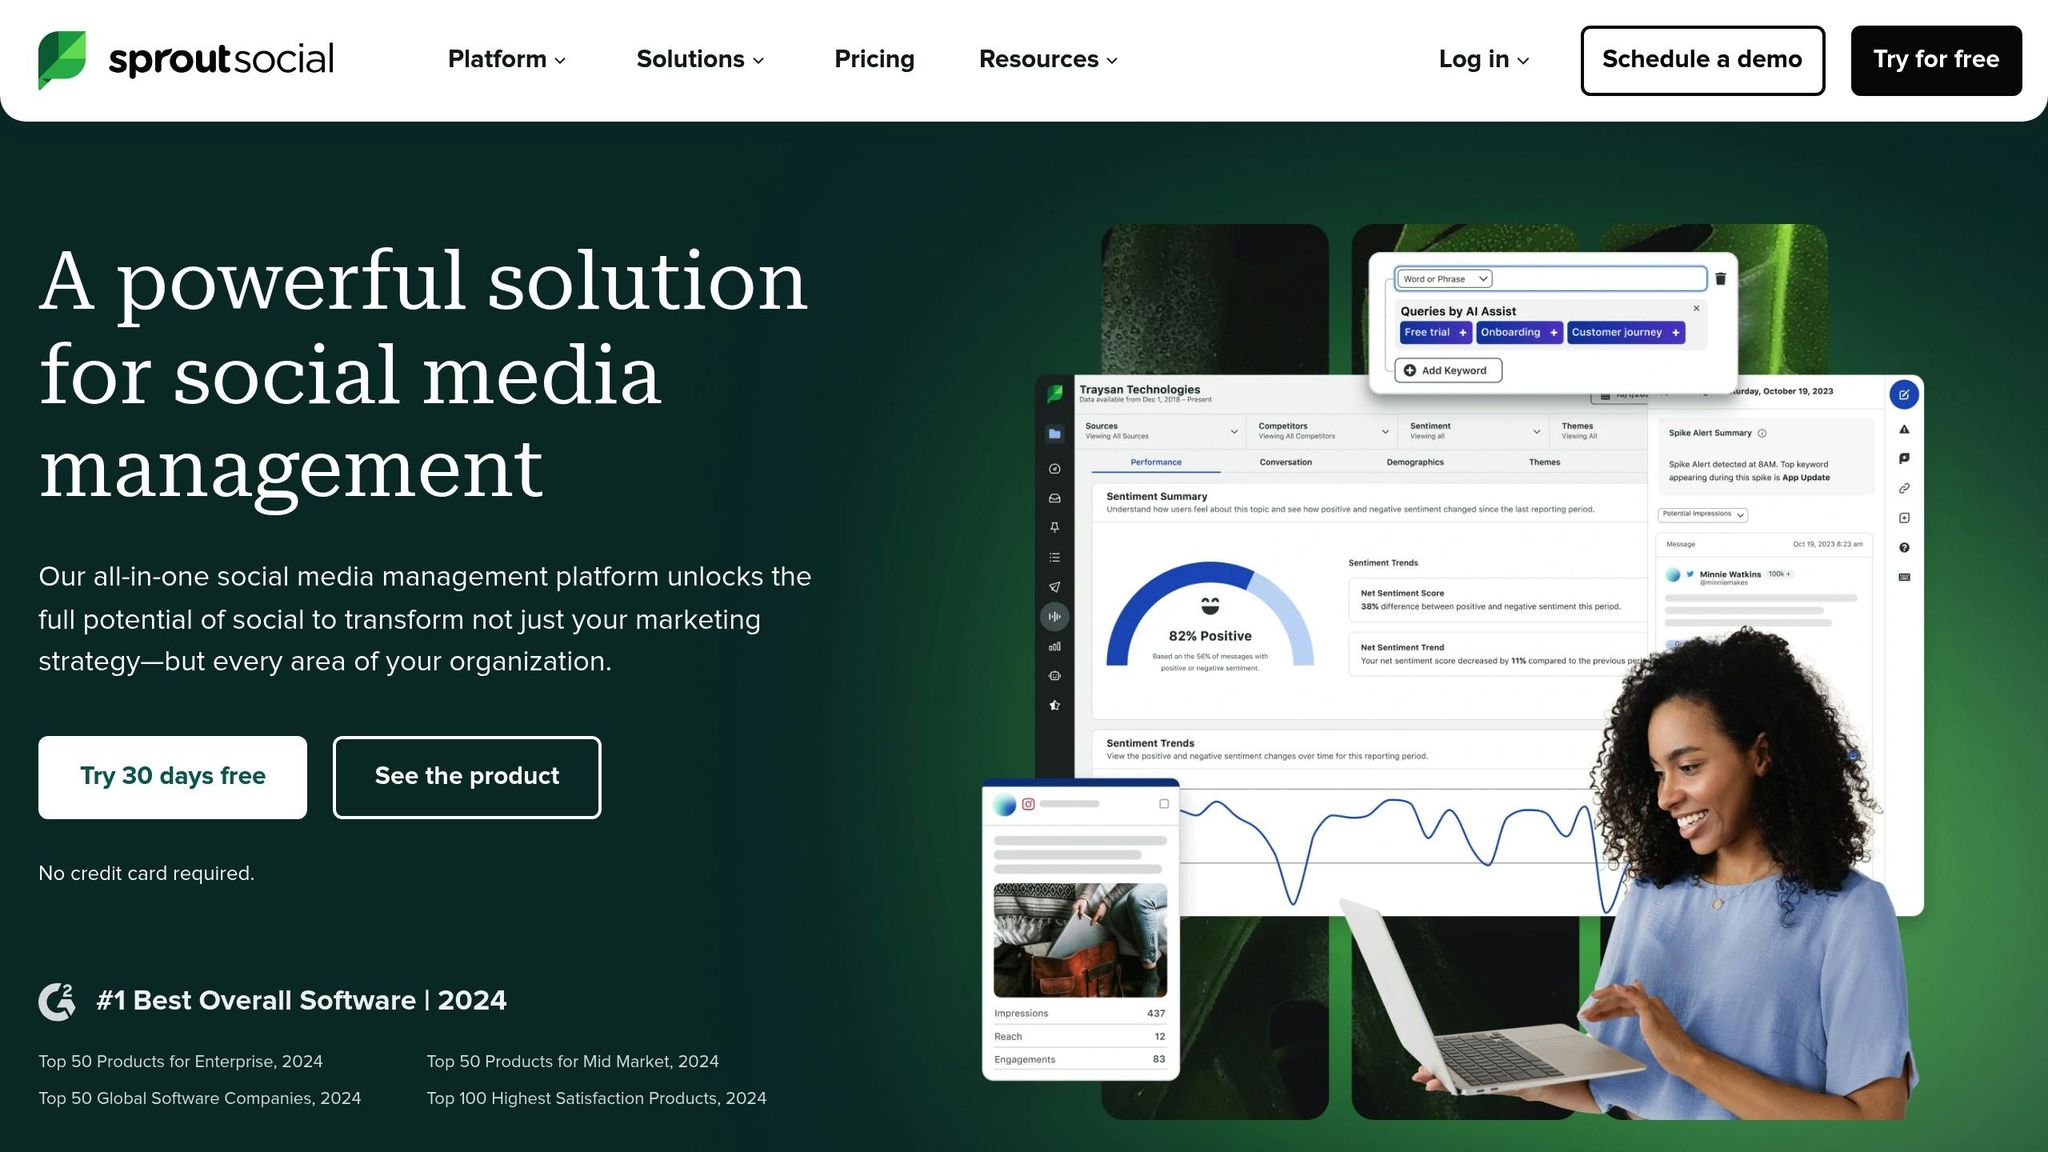
Sprout Social offers advanced analytics starting at $249/month. It’s a powerful choice for tracking performance across major social platforms, thanks to features like:
- Real-Time Performance Tracking: Keep an eye on your reach and impressions as they happen.
- Custom Report Builder: Create branded reports tailored to your specific goals and KPIs.
- Competitive Analysis: See how your performance stacks up against industry benchmarks.
Hootsuite Report Options
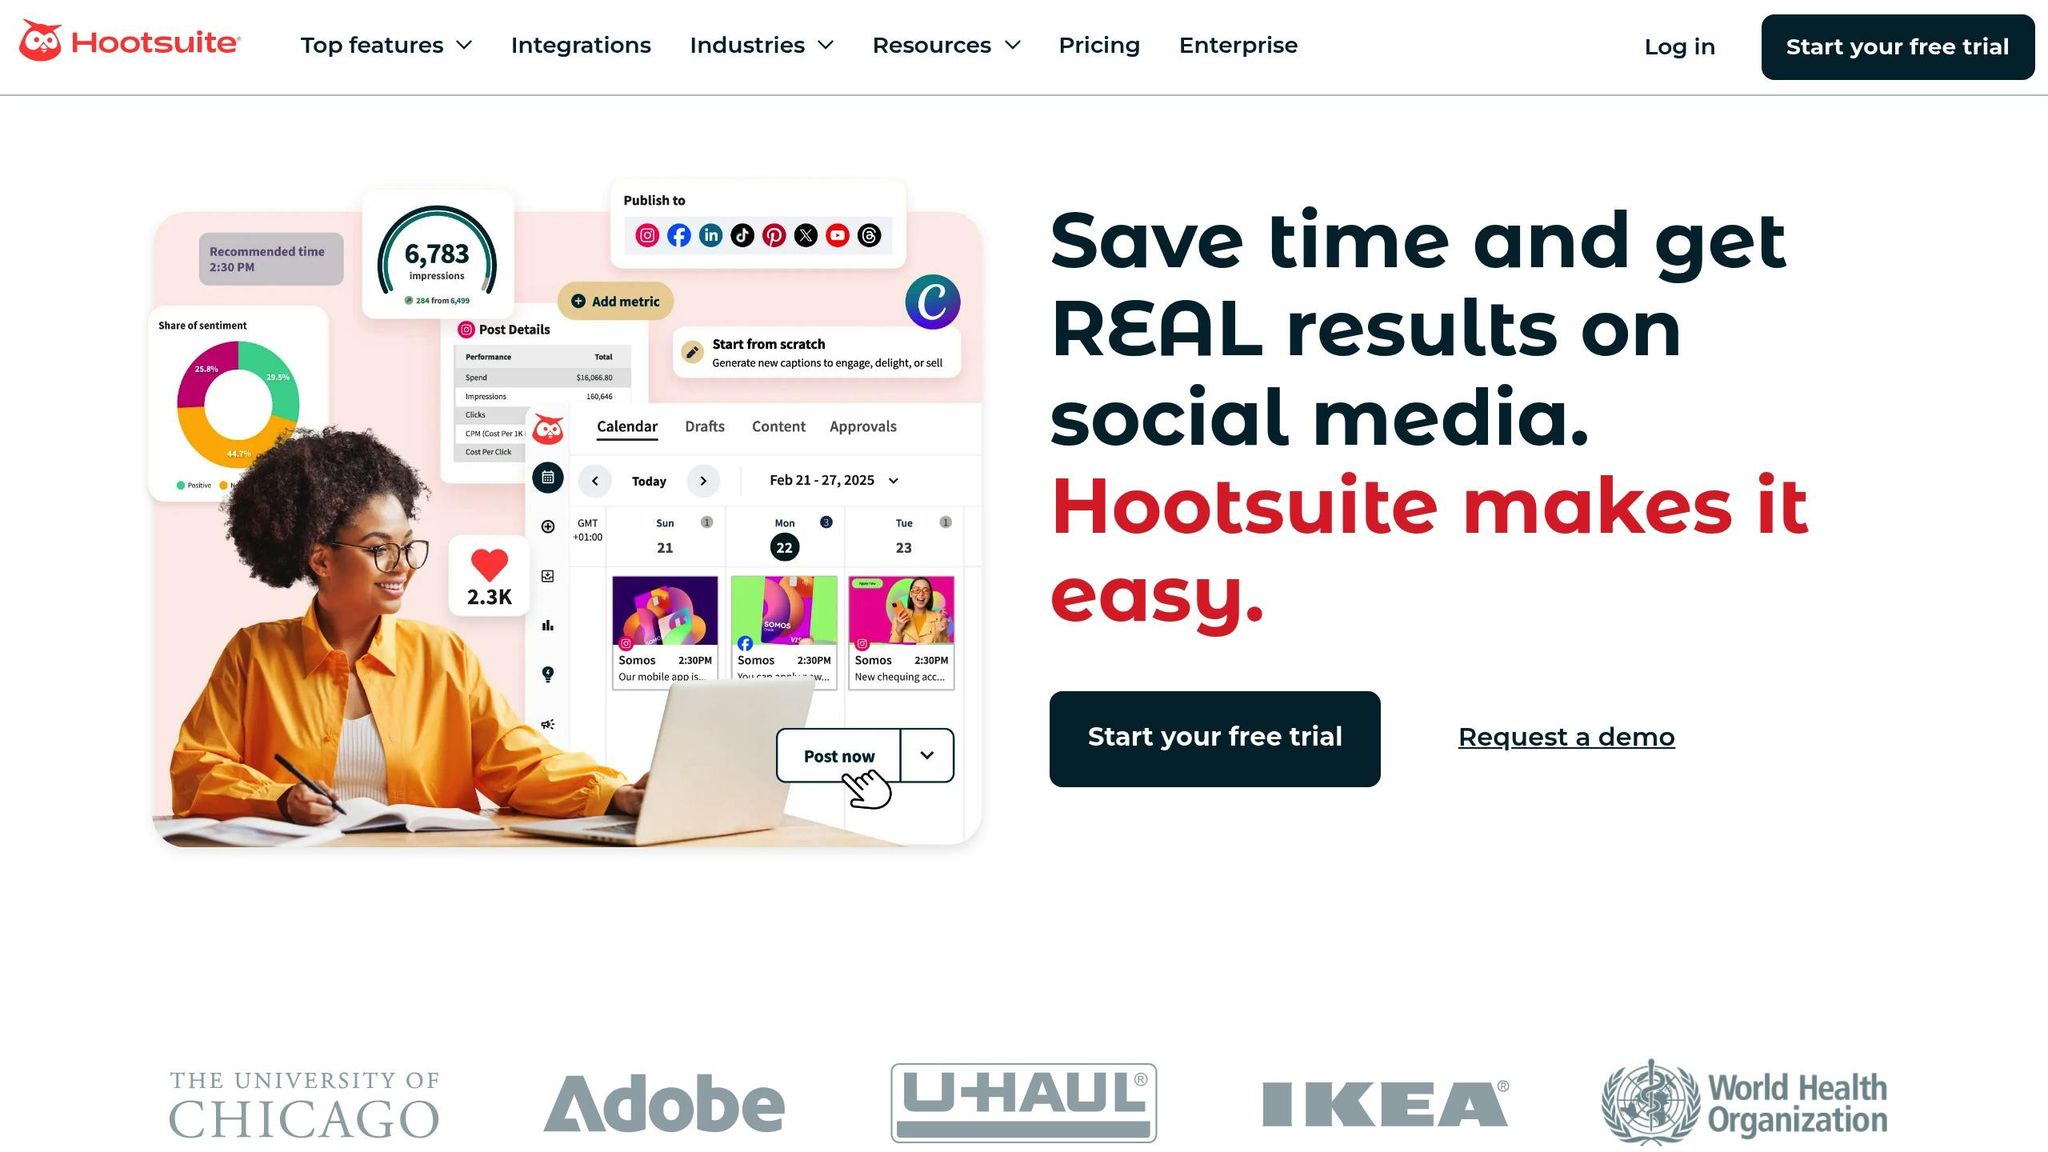
Hootsuite’s analytics platform, starting at $199/month, is another solid option for cross-platform performance tracking. It allows you to customize dashboards and automate reports, making it easier to stay on top of your metrics.
"The analytics dashboard is … invaluable! Hootsuite dashboards provide a birds-eye view on the performance of our many social campaigns. We can quickly analyze the results and create reports at the click of a button." – Slade Meadows, Digital Marketing Manager, Classic of Denton
For those looking for a more specialized tool, Iconosquare delivers streamlined analytics for specific networks.
Iconosquare Performance Tracking
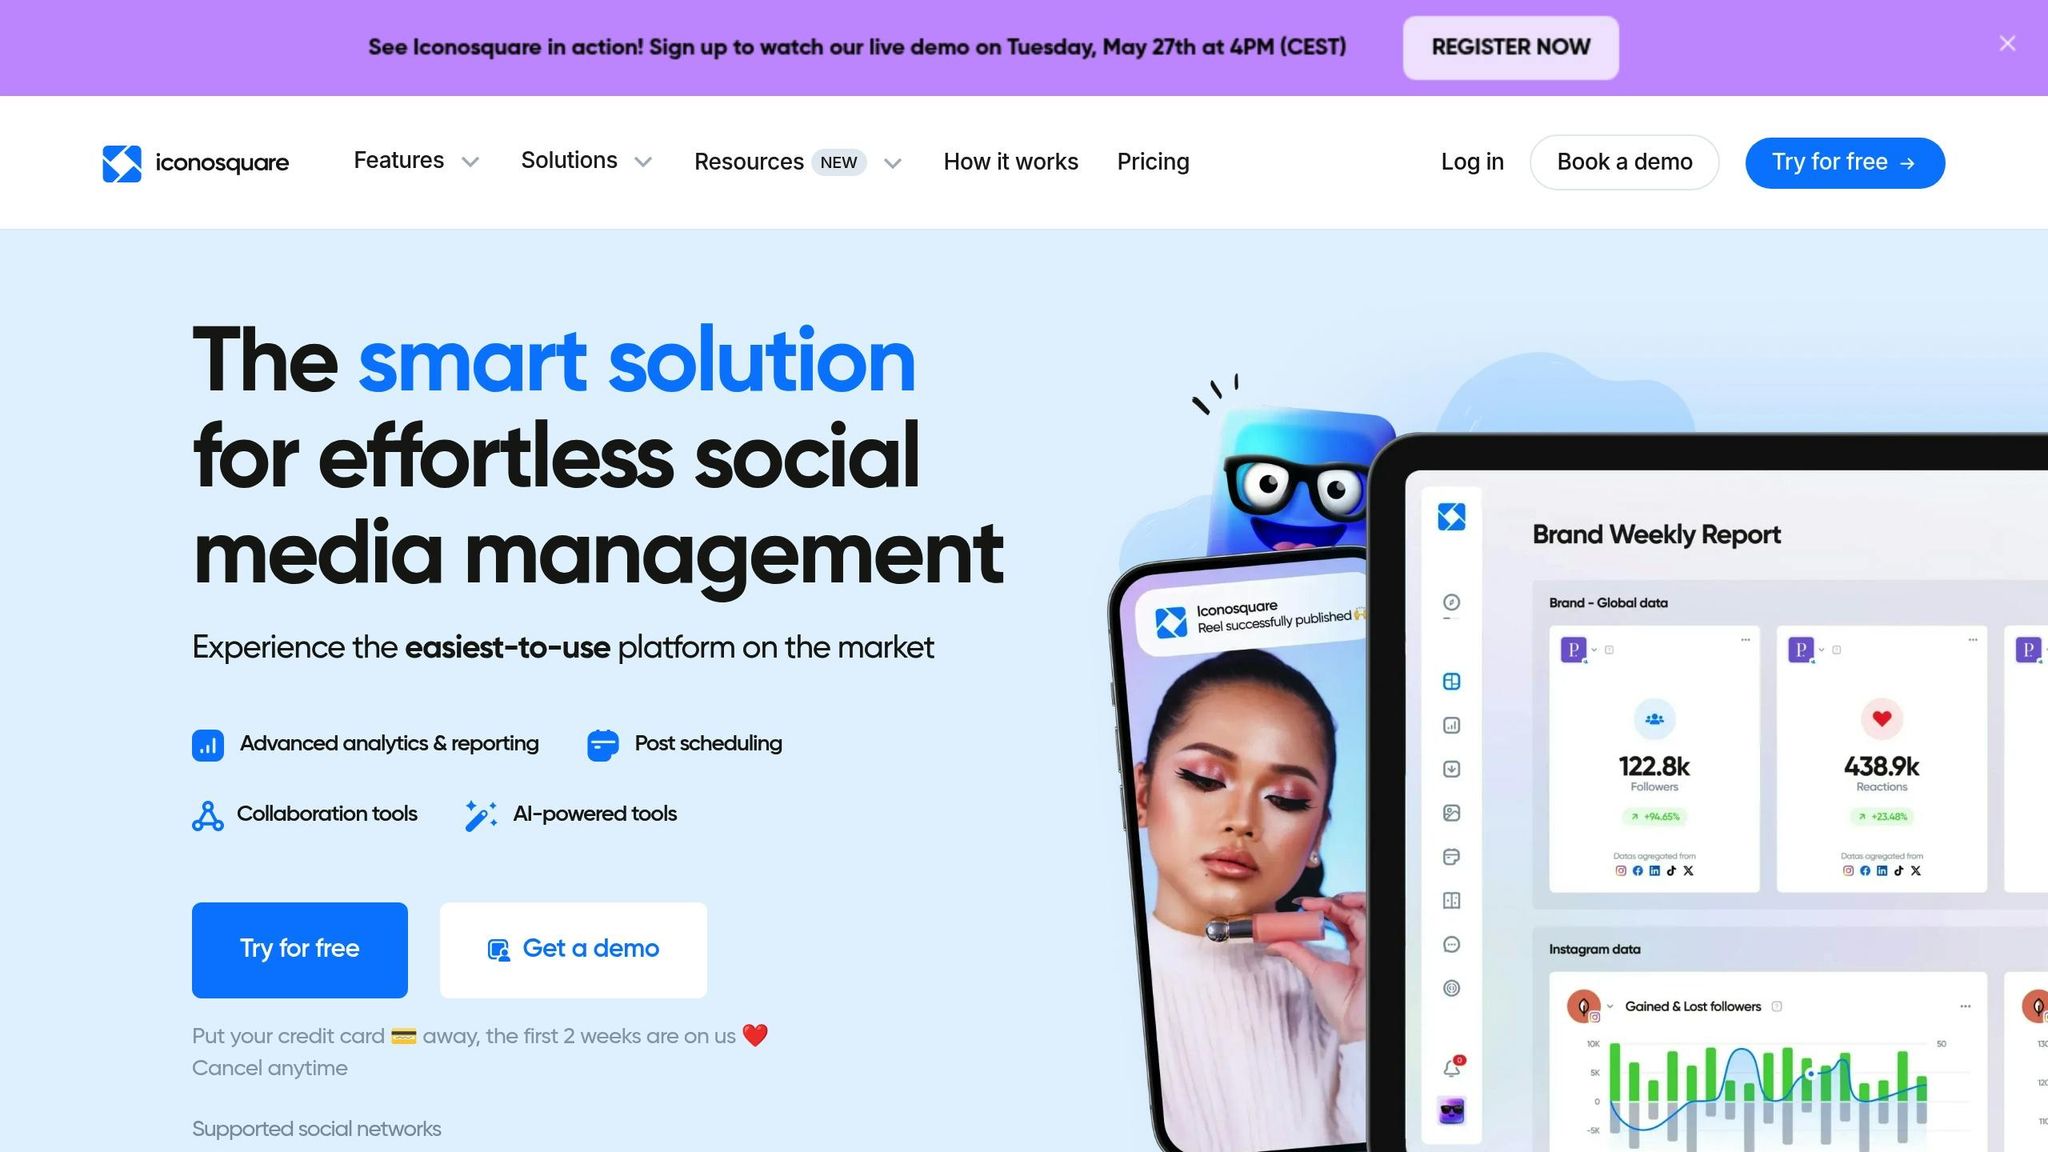
Iconosquare focuses on analytics for Instagram, Facebook, and TikTok, and boasts an impressive 98% customer satisfaction score. It simplifies multi-platform tracking with features like:
| Feature | Benefit |
|---|---|
| Consolidated Metrics | View data from multiple platforms in one place. |
| Performance Insights | Dive deep into reach and impression breakdowns. |
| Automated Reports | Save up to 2 hours per week per client. |
"Easy to use, streamlined analytics, IG/FB/TT all in one place. Super user-friendly and I didn’t have to spend a bunch of time on the platform learning how to do things." – Peyton Dixon, TikTok Lead, Babylist
A standout example comes from Bath & Body Works, which leveraged Emplifi to achieve a 30% increase in customer engagement and a 22% boost in online sales.
When choosing a multi-platform analytics tool, think about how well it integrates with your current systems, the level of customization it offers for reports and dashboards, whether it can scale as your social media presence grows, and the support and training resources available. Budget is also a key factor – focus on tools that offer the best return on investment.
These unified dashboards make analyzing data easier and set the stage for uncovering deeper insights in the next section.
sbb-itb-3792be0
Making Sense of Your Metrics
Understanding platform-specific measurements is essential, but the real value lies in interpreting those metrics to guide your strategy effectively.
Calculating Engagement Rates
Engagement rates are a window into how well your audience connects with your content. Here are three calculations you can use to measure different aspects of engagement:
| Metric Type | Formula | Best For |
|---|---|---|
| Engagement Rate by Reach (ERR) | (Total Engagements ÷ Reach) × 100% | Evaluating organic content performance |
| Engagement Rate by Post (ER post) | (Total Engagements ÷ Followers) × 100% | Analyzing individual posts |
| Engagement Rate by Impressions | (Total Engagements ÷ Impressions) × 100% | Assessing the impact of paid content |
As a benchmark, LinkedIn leads in engagement with an average rate of 2.8%, followed by TikTok and Instagram at 2%, Instagram Reels at 1.9%, X (formerly Twitter) at 1.6%, and Facebook at 1.4%.
Once you’ve calculated these rates, dig deeper into your data to identify patterns in audience behavior.
Finding Performance Patterns
Metrics aren’t just numbers – they tell a story. For example, in e-commerce, successful campaigns often achieve reach rates between 40% and 60%, with around five impressions per user. These indicators can help you understand how your content is performing:
- High reach, low impressions: Your content is reaching a broad audience but isn’t being revisited.
- High impressions, low reach: Your message is repeatedly hitting the same group of users.
- Balanced metrics: Suggests your targeting is on point, with a good balance of exposure and frequency.
By identifying these patterns, you can fine-tune your strategy for better results.
Common Measurement Mistakes
A case study involving a luxury skincare brand highlights the risks of focusing on the wrong metrics. The brand achieved 500,000 monthly impressions across Instagram and Facebook but saw only a 2% engagement rate and a 0.3% conversion rate. By shifting their focus to meaningful engagement – like using targeted ads and customer testimonials – they boosted engagement to 8% and reduced customer acquisition costs by 40%.
Here are common pitfalls to avoid:
- Overemphasis on single metrics: Don’t rely solely on reach or impressions. Look at them together for a complete picture.
- Ignoring context: Big numbers don’t always equal success. Align your metrics with your goals and audience.
- Failing to track trends: Regularly monitor performance over time to spot seasonal shifts or changes in audience behavior.
- Neglecting content quality: High reach with low engagement often indicates content that doesn’t resonate with your audience.
"About four or five years ago, when we were still measuring impressions, we were getting more impressions than there were people in the world." – Jessica Onick, Veteran Communicator and Data Analyst, Citrix
To get the most out of your metrics, prioritize engagement quality over sheer numbers, analyze trends consistently, and adjust your approach based on real data – not assumptions.
Improving Your Metrics
Want to level up your social media game? With platforms like Facebook reaching just over 5% of followers per post, it’s clear that strategic planning is key. Let’s dive into some proven tactics to expand your reach, reuse content effectively, and sharpen your targeting.
Boost Natural Post Reach
Social media algorithms love content that sparks meaningful interactions. In fact, 36% of consumers say they’re drawn to brands that engage with them on a deeper level. Here’s how you can make your posts algorithm-friendly:
Timing Matters
Use analytics to figure out when your audience is most active and schedule posts during those peak times.
Smart Hashtag Use
Pick hashtags that resonate with your audience and your content. For example, the City of Miami Beach’s 2024 "Breaking Up with Spring Break" campaign used POV-style videos and strategic hashtags to rack up over 20 billion views.
Engage Directly
Responding to comments and messages can make or break customer loyalty. A whopping 73% of social media users said they’d switch to a competitor if a brand doesn’t engage with them. Try adding polls or Q&A sessions to your posts to keep the conversation flowing.
Reuse Top-Performing Content
Why reinvent the wheel when you can repurpose what’s already working? A solid 65% of marketers say repurposing content is more budget-friendly than creating something entirely new.
"Distribute ideas, not blog posts. Focus on delivering value natively instead of ‘hey go read this thing I wrote.’" – Sneh Ratna Choudhary, Chief Repurposer at Scaling Rad Content
A great example? Socialinsider refreshed a LinkedIn post that initially reached 243 impressions. After tweaking it, the same post soared to 36,000 impressions in 2024.
Test and Target Content
Refining your content strategy is an ongoing process. Testing can reveal what resonates most with your audience. Did you know that user-generated content (UGC) generates engagement 6.9 times higher than brand-created posts?
Experiment with Themes
Develop content series around specific topics to keep your audience hooked. For instance, Tiffany Yu’s "The Anti-Ableism Series" attracted over 5 million views and even led to a book deal.
Target Specific Audiences
Collaborating with influencers or featuring relatable content can amplify engagement. Lili Origin’s partnership with influencer Nishtha Sharma, for example, brought in over 800 likes and 21 comments – far outperforming their non-UGC posts.
| Content Type | Best Practices | Expected Impact |
|---|---|---|
| Video Content | Use platform-specific formats | Boost organic reach |
| UGC Campaigns | Highlight customer stories | 6.9x higher engagement |
| Interactive Posts | Add polls and questions | More comments |
| Educational Content | Share valuable insights | Better audience retention |
Summary
Keep an eye on reach and impressions to fine-tune your content’s performance. According to recent data, 58% of marketers actively track these metrics to evaluate how well their campaigns are performing.
Why do these numbers matter? They help you understand how well your content connects with your audience. For example, smaller Instagram accounts tend to reach over 25% of their followers, while larger accounts average just 13.8%. This insight can shape how you approach your content strategy.
Here’s a quick guide to interpreting common metric scenarios and deciding on your next steps:
| Metric Combination | What It Means | Action Needed |
|---|---|---|
| High Impressions + Low Engagement | Your content isn’t grabbing attention effectively | Strengthen your call-to-action |
| High Impressions + High Engagement | Your content is hitting the mark | Reuse and refine successful elements |
| High Reach + Low Impressions | People aren’t coming back for more | Focus on improving content quality |
| High Impressions + Low Reach | Your audience is too narrow | Broaden your targeting strategy |
To get the full picture, combine native analytics tools with third-party platforms. While built-in tools offer solid insights, options like Sprout Social or Hootsuite provide a more comprehensive, cross-channel view.
Stay on top of your data and adapt your approach. Boost content quality, schedule posts during peak activity times, and use targeted hashtags to maximize your reach and impressions across all platforms. These steps can help you get the most out of your social media efforts.
FAQs
How can I use reach and impressions to improve my social media strategy?
To get the most out of your social media strategy, it’s crucial to grasp the difference between reach and impressions. Simply put, reach is the number of unique individuals who see your content, while impressions reflect the total number of times your content is displayed – even if the same person views it multiple times.
By diving into these metrics, you can uncover what’s working and what needs tweaking. For instance:
- A high reach but low impressions might mean your content isn’t engaging enough to encourage repeat views.
- On the other hand, if impressions are high compared to reach, it suggests your audience is engaging well, which can boost brand visibility.
This data can guide your next steps. If your reach is low, try refining your targeting or experimenting with new content formats to draw in fresh viewers. If your engagement is lagging despite a broad reach, focus on crafting posts that are more interactive, relevant, or visually striking. Regularly analyzing these metrics ensures your content stays aligned with your goals and resonates with your audience.
What are the advantages of using analytics tools like Sprout Social or Hootsuite to measure social media performance?
Analytics tools like Sprout Social and Hootsuite simplify tracking your social media performance across different platforms by offering a single, easy-to-navigate dashboard. With these tools, you can effortlessly compare key metrics like reach, impressions, and engagement – all in one place – saving both time and energy.
What makes these platforms even more helpful is their advanced reporting capabilities. They allow you to visualize your data in a way that’s easy to understand, making it simpler to spot trends and make informed decisions. Plus, with real-time monitoring, you can quickly tweak your strategy to keep your audience engaged and stay ahead of the curve. These tools take the complexity out of analytics, helping you focus on achieving better results without unnecessary hassle.
What are some common mistakes to avoid when analyzing social media reach and impressions?
When evaluating reach and impressions on social media, it’s important to steer clear of a few common mistakes:
- Mixing up reach and impressions: Reach is all about the number of unique users who see your content, while impressions count how many times it’s viewed, even if the same person sees it multiple times. Confusing the two can lead to misleading insights about your content’s performance.
- Ignoring platform-specific nuances: Different platforms define and calculate reach and impressions in their own ways. For instance, some may count an impression even if the content wasn’t fully visible. Knowing these variations is key for an accurate analysis.
- Overemphasizing impressions: Impressions simply show how often your content is displayed, but they don’t tell you anything about engagement or impact. Focusing solely on impressions might push you toward strategies that prioritize visibility over real audience interaction.
By avoiding these pitfalls, you can interpret your data more effectively and make smarter choices to elevate your social media game.